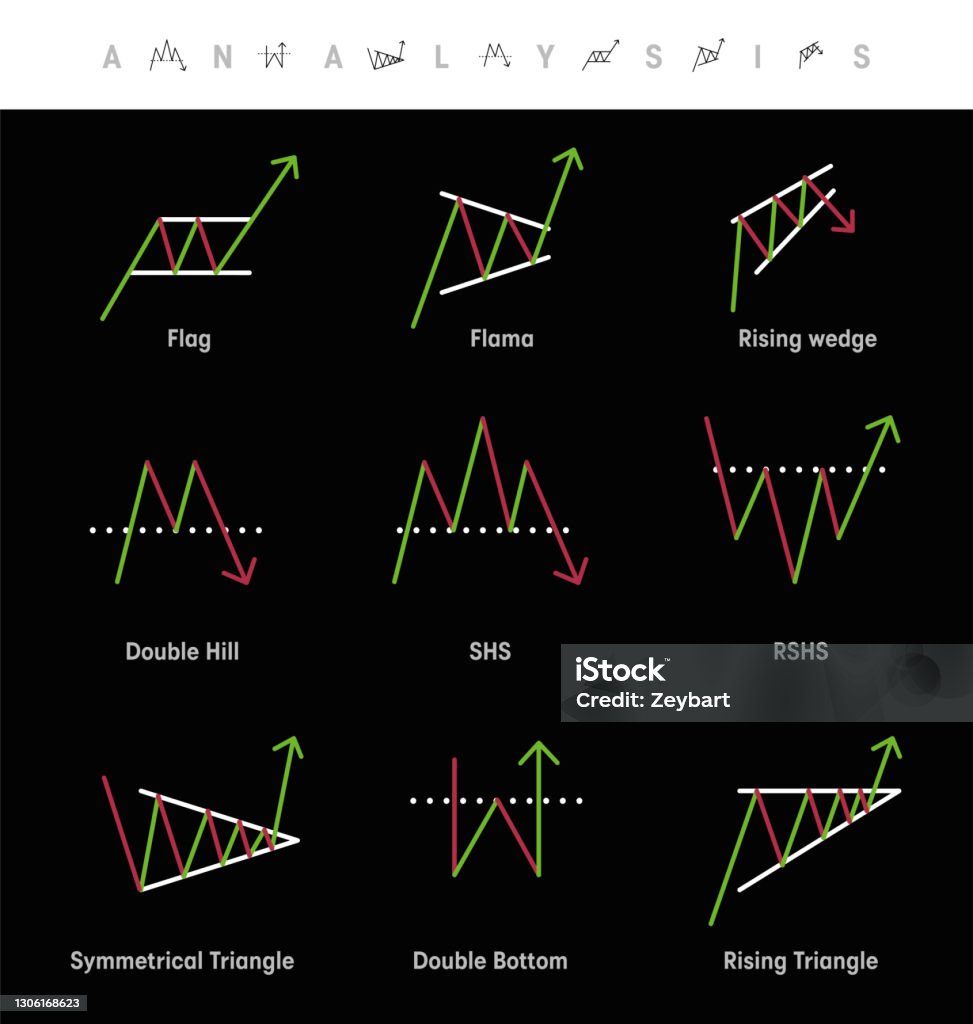
Forex chart patterns:
Forex chart patterns are visual representations of price movements in currency markets.
They help traders identify potential future price movements based on past patterns.
Patterns like triangles, head and shoulders, and flags indicate potential shifts in market sentiment.
Traders use these patterns to anticipate price direction and make informed trading decisions.
For example, a head and shoulders pattern suggests a possible trend reversal, while a triangle pattern may indicate a period of consolidation before a breakout.
Understanding these patterns can assist traders in identifying entry and exit points, enhancing their chances of profitable trading.
importantly of chart patterns in Forex trading:
Chart patterns play a crucial role in Forex trading by providing visual clues about potential price movements.
They help traders identify market trends, reversals, and consolidation phases, aiding in decision-making.
By recognizing patterns like head and shoulders, triangles, and flags, traders can anticipate future price directions and adjust their strategies accordingly.
These patterns serve as valuable tools for entry and exit points, risk management, and overall trade planning.
Understanding and interpreting chart patterns enable traders to make informed decisions. Increasing the likelihood of profitable trades in the dynamic Forex market.
Common forex chart patterns;
There’s are some common forex chart patterns
1.accending triangle
2 disaccending triangle
2.double top
3 double bottom
3 . rising wedge
4 falling wedge
5.haeder shoulder
6.inverted harder shoulder
7.cup and hand
8.inverted hand cup
9.barish flage
10.burish flage
11.rising chanle
12.falling chanle
Common forex chart patterns are visual representations of price movements that occur frequently in currency markets.
These patterns provide valuable insights into market dynamics and help traders identify potential opportunities for profit.
Some of the most common forex chart patterns include:
1. **Head and Shoulders:** This pattern typically indicates a trend reversal.
It consists of three peaks, with the middle peak being the highest (the head), flanked by two lower peaks (the shoulders).
2. **Double Top/Bottom
:** These patterns signal a potential reversal in the current trend.
A double top forms when price reaches a peak twice, failing to break higher.while a double bottom forms when price hits a low twice, failing to break lower.
3. **Triangles:
Triangles represent periods of consolidation before a breakout or breakdown.
They can be symmetrical, ascending, or descending, depending on the shape of the pattern.
4. **Flags and Pennants:
These patterns occur after a strong price movement. And represent a temporary pause or consolidation before the continuation of the trend.
Flags are rectangular-shaped, while pennants are small symmetrical triangles.
5. **Wedges:
Wedges are similar to triangles but have converging trend lines.
They can be either rising (bullish) or falling (bearish) and typically indicate a potential reversal or continuation of the trend.
6. **Cup and Handle:
** This pattern forms a rounded bottom (the cup) followed by a smaller consolidation period (the handle).
It often signals a bullish continuation pattern.
7. **Rounding Bottom:
** Also known as a saucer bottom, this pattern indicates a gradual shift from a downtrend to an uptrend.
It forms a rounded shape at the bottom of the price chart.
By combining chart patterns with other technical indicators and fundamental analysis.
Traders can enhance their decision-making process and improve their chances of success in the forex market.

Trend reversal pattern:
A trend reversal pattern in trading indicates a potential change in the direction of a market trend.
It occurs when the prevailing trend, whether up or down, shows signs of weakening and is likely to reverse.
Common trend reversal patterns include the head and shoulders, double top/bottom, and rounding bottom.
Traders look for these patterns to anticipate shifts in market sentiment and adjust their positions accordingly.
Chart patterns range bound market;
Chart patterns in a range-bound market indicate periods when prices fluctuate within a defined price range without establishing a clear trend.
These patterns, such as rectangles or sideways channels, reflect a balance between buying and selling pressure. Resulting in price movements confined between support and resistance levels.
Traders identify these patterns to anticipate potential breakouts or breakdowns from the range boundaries.
They may employ range-bound trading strategies, such as buying near support and selling near resistance, to capitalize on price within the range.
Understanding chart patterns in range-bound markets helps traders adapt their strategies to changing market conditions for profitable trading.
Countines pattern;
Continuation patterns in trading suggest that the prevailing trend is likely to continue after a temporary pause or consolidation.
These patterns occur when the price takes a breather within an ongoing trend before resuming its movement in the same direction.
Examples of continuation patterns include flags, pennants, and triangles.
Traders recognize these patterns as opportunities to enter trades in alignment with the existing trend, continuation of price movement.
By identifying continuation patterns, traders can enhance their ability to ride trends effectively and maximize profit potential in the financial markets.
Risk management strategies for forex chart patterns:
Risk management strategies for forex chart patterns involve measures to protect capital and minimize losses while trading based on pattern analysis.
Traders typically set stop-loss orders to exit trades if price moves against their expectations, limiting potential losses.
Additionally, position sizing techniques, such as risking a small percentage of capital per trade, help manage overall portfolio risk.
Properly identifying and confirming chart patterns, combined with disciplined execution of risk management techniques.
Traders to mitigate the inherent risks associated with pattern-based trading.
This approach promotes longevity in trading and enhances the probability of achieving consistent profitability in the forex market.
At the forex market chart patterns helps very much in the analysis of market.
.if I read and learn properly about chart patterns he gives him a lot profit . different types or trend and patterns this is the indicated the market the the trade .And give me a good entry fore trade .
Forex chart patterns very important in forex trading because patterns tells me about which side market move ups and downs.after break out.
1 thought on “FOREX CHART PATTERNS”