Fibonacci in Trading :
Using levels based on the Fibonacci sequence, Fibonacci tools for trading assist in predicting price movements.
After a significant move, key levels (23.6%, 38.2%, 50%, and 61.8%) indicate where prices might retrace or extend.
These levels are utilized by traders to establish strategic .like entry and exit points and to identify potential support and resistance.
You can think of these levels as a blueprint from nature that will precisely direct you through market waves.
When traders incorporate Fibonacci retracements, extensions, fans, arcs, and time zones into their analysis,.
They are able to discover hidden patterns and consequently make trading decisions that are more well-informed and self-assured.
Uptrend in Fibonacci in Trading:
Traders can use Fibonacci retracement levels in an uptrend to figure out where a price pullback .
Might find support before continuing on its upward trajectory.
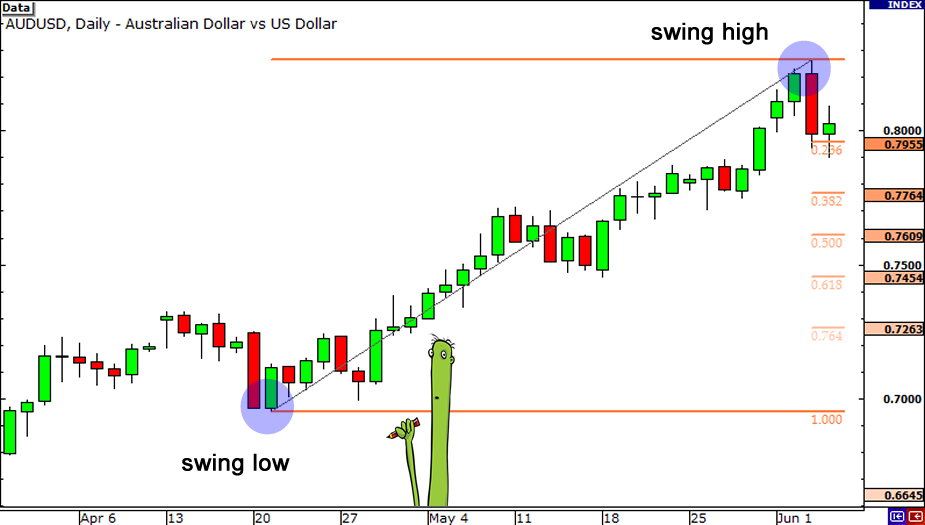
Traders use the Fibonacci levels (23.6%, 38.2%, 50%, and 61.8%) from the move’s low to its high after a significant price rise.
These levels are like invisible compass points that indicate potential areas where buyers might enter the market.
Imagine ascending a staircase, where each step (the Fibonacci level) gives you a chance to breathe before moving on.
Traders can more effectively ride the trend by strategically planning their entries, exits, and stop-losses using these levels.
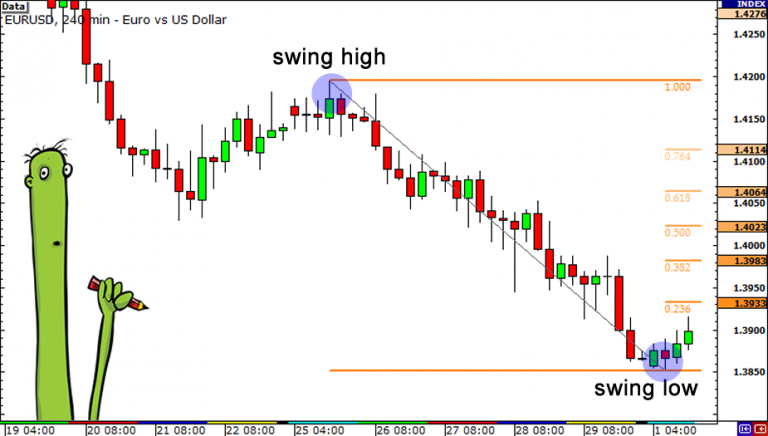
Down Trend fiibonacci in Trading :
Traders can use Fibonacci retracement levels to identify potential resistance levels in a downtrend.
Which are points at which a price bounce might reverse and continue falling.
After a critical cost drop, brokers draw Fibonacci levels (23.6%, 38.2%, half, 61.8%) from the high to the low of the move.
These levels serve as markers, pointing in the direction that sellers might regain control.
Imagine going down a staircase, with each step (the Fibonacci level) providing a brief pause before proceeding.
Traders’ ability to effectively navigate the downtrend can be enhanced by strategically planning entries, exits, and stop-losses using these levels.
Why the Trader like Fibonacci in Trading:
Why Traders Love Fibonacci Tools Fibonacci tools are adored by traders. Due to their adaptability and compatibility with other technical analysis techniques.
They are often used to confirm signals from other tools .
like moving averages, RSI, or MACD, so they are more than just indicators on their own.
The robustness of trading strategies is enhanced by this multifaceted approach.
And Fibonacci levels provide a clear framework for establishing entry and exit points.
Stop-loss orders placed just above these levels by traders ensure a disciplined approach to risk management.
In a similar vein, strategic take-profit levels at important Fibonacci extensions can be established in accordance with potential market targets.
The Origins of Fibonacci in Trading:
The Starting points of FibonacciThe Fibonacci grouping.
Named after the Italian mathematician Leonardo of Pisa (known as Fibonacci).
ls a progression of numbers where each number is the amount of the two going before ones: 0, 1, 1, 2, 3, 5, 8, 13, etc.
This succession isn’t simply a numerical interest; it’s found all through nature, from the plan of passes on a stem to the twisting of cosmic systems.
Due to its pervasive presence in natural patterns, traders have investigated its use in financial markets.
summary
Summary The Fibonacci method of market analysis doesn’t go over well with everyone.
Because so many people are watching the levels.
Which do not possess any particular “magical” properties, some simply believe that they are a self-fulfilling prophecy.
However, it can provide additional insight into potential market turning points that may not be immediately apparent, even to the skeptic.
When trading with technical indicators, risk management strategies should always be taken into account.